Debugging with your IDE
The debugger is a powerful tool to navigate the internals of the compiler and track bugs.
You can start the Scala debugger in VSCode using Metals. In this page you will learn how to configure it, and how to use it.
Importing the project in VSCode using Metals
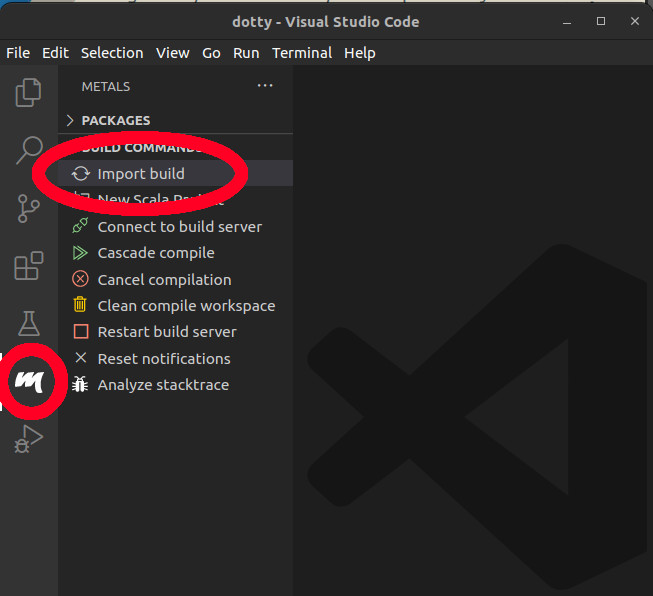
The first step is to import the build in Metals, if it has not yet been imported.
To do so you can open the lampefl/dotty repository in VSCode and click Import build in Metals view. It may take a few minutes to import, compile and index the full project.
If you have any trouble with importing, you can try to switch the build server from Bloop to sbt, by running the Metals: Switch build server command from VSCode command palette.
Debugging the unit tests
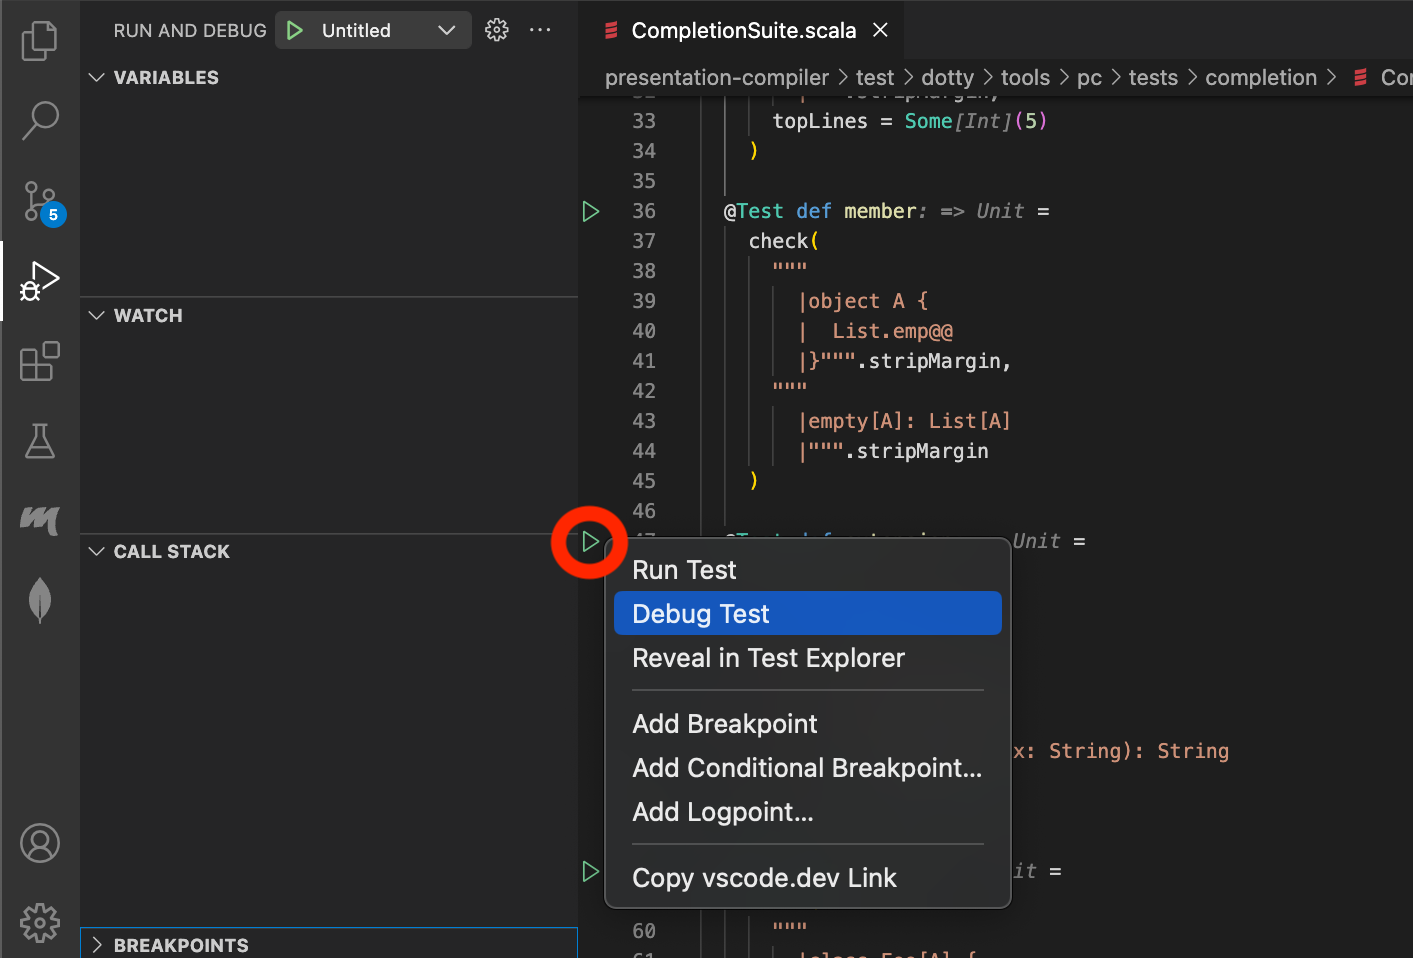
If the module you're working on contains unit tests, you can debug a specific one without any additional work. It can be accomplished by running Debug Test code lens on an exact test case.
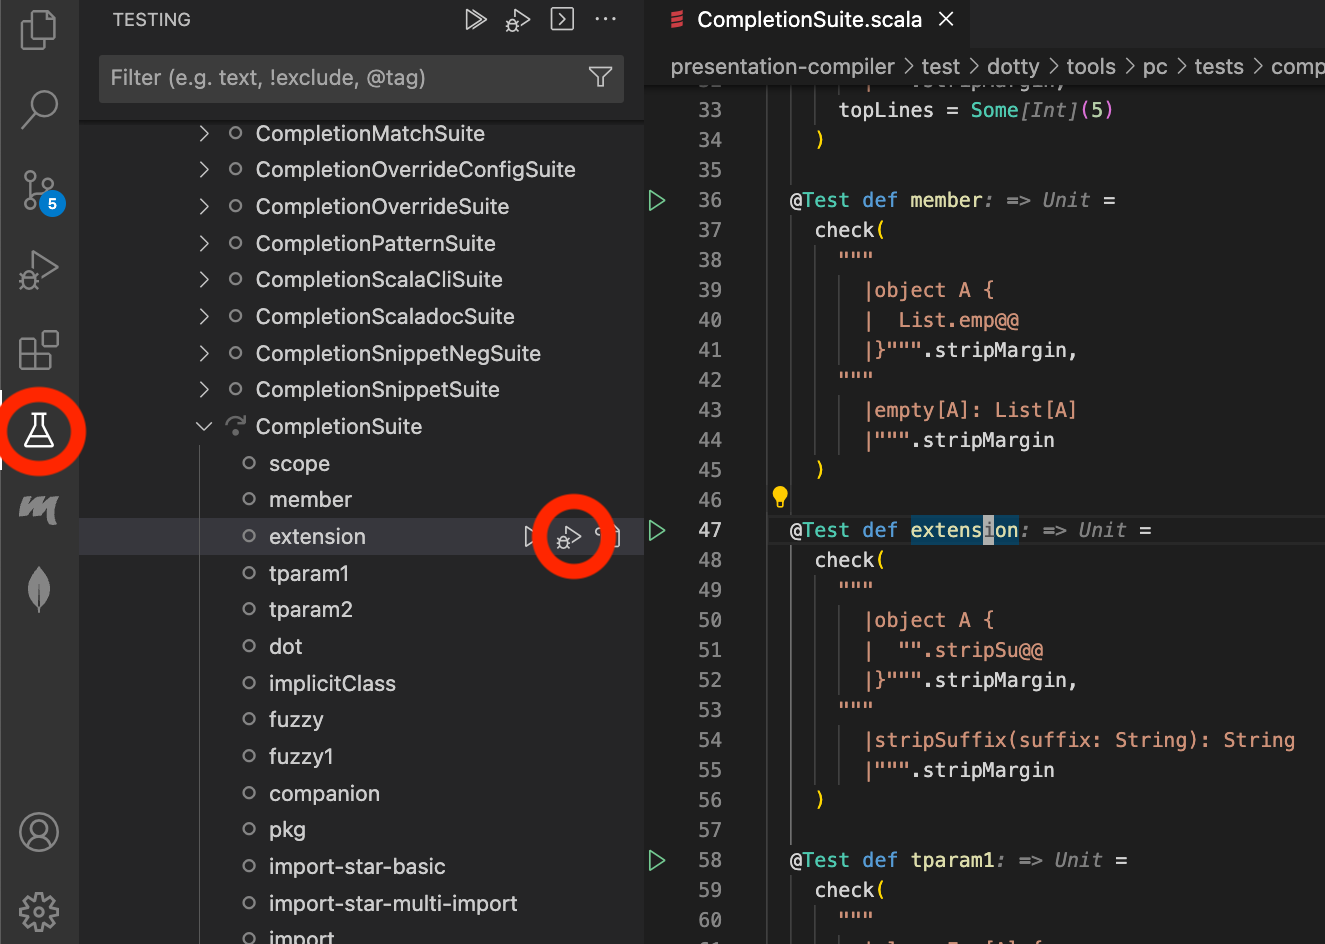
The second way to run a unit test is to use the test explorer tab, which lists all available test cases. The debugger is started either by pressing a debug button or by selecting Debug Test option from the menu.
Debugging the compilation
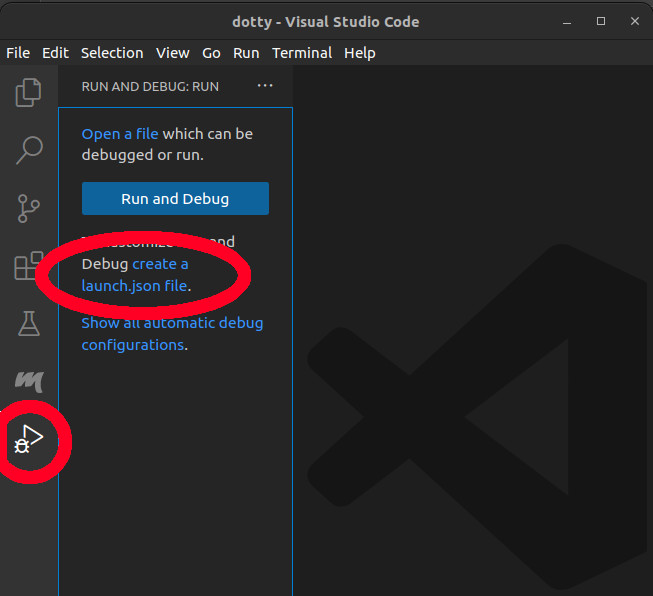
Debugging of the compilation requires additional configuration in order to work. In VSCode, you can go to the Run and Debug view and click create a launch.json file. It creates the launch.json file in the .vscode folder, in which we will define the debug configurations.
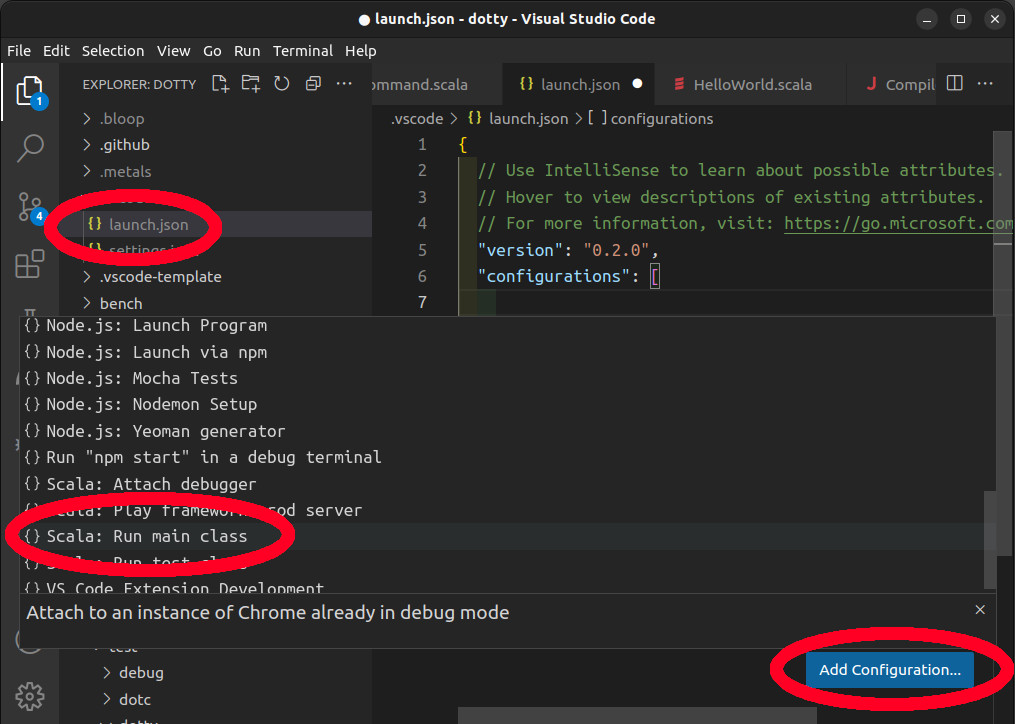
To create a debug configuration:
- Open the
.vscode/launch.jsonfile - Click the
Add Configurationbutton - Go down the list of templates and select
Scala: Run main class
The added configuration should look like this:
{
  "type": "scala",
  "request": "launch",
  "name": "Untitled",
  "mainClass": "???",
  "args": [],
  "jvmOptions": [],
  "env": {}
}
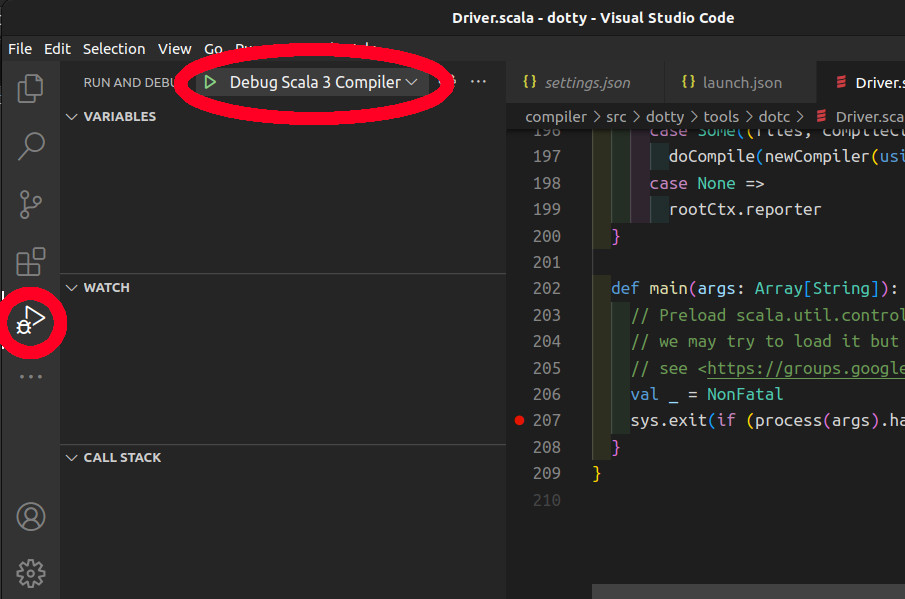
This is a template that you need to fill out. First You can give a name to your configuration, for instance Debug Scala 3 Compiler.
The two most important parameters, to debug the compiler, are mainClass and args. The mainClass of the compiler is dotty.tools.dotc.Main. In the args you need to specify the compiler arguments, which must contain at least a Scala file to compile and a -classpath option.
To start with, we can compile the ../tests/pos/HelloWorld.scala file. In the classpath, we always need at least the scala-library_2.13 and the bootstrapped scala3-library_3. To locate them on your filesystem you can run the export scala3-library-bootstrapped/fullClasspath command in sbt.
$ sbt
> export scala3-library-bootstrapped/fullClasspath
/home/user/scala/scala3/out/bootstrap/scala3-library-bootstrapped/scala-3.3.1-RC1-bin-SNAPSHOT-nonbootstrapped/classes:/home/user/.cache/coursier/v1/https/repo1.maven.org/maven2/org/scala-lang/scala-library/2.13.10/scala-library-2.13.10.jar
[success] Total time: 1 s, completed Mar 10, 2023, 4:37:43 PM
Note that it is important to use the bootstrapped version of the scala3-library to get the correct TASTy version.
Additionally you can add the -color and never arguments to prevent the compiler from printing ANSI codes as strings in the debug console.
Here is the final configuration:
{
  "type": "scala",
  "request": "launch",
  "name": "Debug Scala 3 Compiler",
  "mainClass": "dotty.tools.dotc.Main",
  "args": [
    "../tests/pos/HelloWorld.scala",
    "-classpath",
    // To replace with your own paths
    "/home/user/scala/scala3/out/bootstrap/scala3-library-bootstrapped/scala-3.3.1-RC1-bin-SNAPSHOT-nonbootstrapped/classes:/home/user/.cache/coursier/v1/https/repo1.maven.org/maven2/org/scala-lang/scala-library/2.13.10/scala-library-2.13.10.jar",
    "-color",
    "never"
    ],
  "jvmOptions": [],
  "env": {}
}
Customizing the debug configurations
Compiling several files at once
You can compile more than one Scala file, by adding them in the args:
"args": [
  "file1.scala",
  "file2.scala",
  "-classpath",
  "/home/user/scala/scala3/out/bootstrap/scala3-library-bootstrapped/scala-3.3.1-RC1-bin-SNAPSHOT-nonbootstrapped/classes:/home/user/.cache/coursier/v1/https/repo1.maven.org/maven2/org/scala-lang/scala-library/2.13.10/scala-library-2.13.10.jar"
]
Depending on a library
To add a dependency to an external library you need to download it and all its transitive dependencies, and to add them in the classpath. The Coursier CLI can help you to do that. For instance to add a dependency to cats you can run:
$ cs fetch org.typelevel::cats-core:2.+ --classpath --scala-version 3 --exclude org.scala-lang:scala-library --exclude org.scala-lang:scala3-library
/home/user/.cache/coursier/v1/https/repo1.maven.org/maven2/org/typelevel/cats-core_3/2.9.0/cats-core_3-2.9.0.jar:/home/user/.cache/coursier/v1/https/repo1.maven.org/maven2/org/typelevel/cats-kernel_3/2.9.0/cats-kernel_3-2.9.0.jar
And concatenate the output into the classpath argument, which should already contain the scala-library_2.13 and the bootstrapped scala3-library:
"args": [
  "using-cats.scala",
  "-classpath",
  "/home/user/scala/scala3/out/bootstrap/scala3-library-bootstrapped/scala-3.3.1-RC1-bin-SNAPSHOT-nonbootstrapped/classes:/home/user/.cache/coursier/v1/https/repo1.maven.org/maven2/org/scala-lang/scala-library/2.13.10/scala-library-2.13.10.jar:/home/user/.cache/coursier/v1/https/repo1.maven.org/maven2/org/typelevel/cats-core_3/2.9.0/cats-core_3-2.9.0.jar:/home/user/.cache/coursier/v1/https/repo1.maven.org/maven2/org/typelevel/cats-kernel_3/2.9.0/cats-kernel_3-2.9.0.jar"
]
Add more compiler options
In the args you can add any additional compiler option you want.
For instance you can add -Vprint:all to print all the generated trees after each mega phase.
Run scalac -help to get an overview of the available compiler options.
Defining more than one launch configuration
You can create as many debug configurations as you need: to compile different files, with different compiler options or different classpaths.
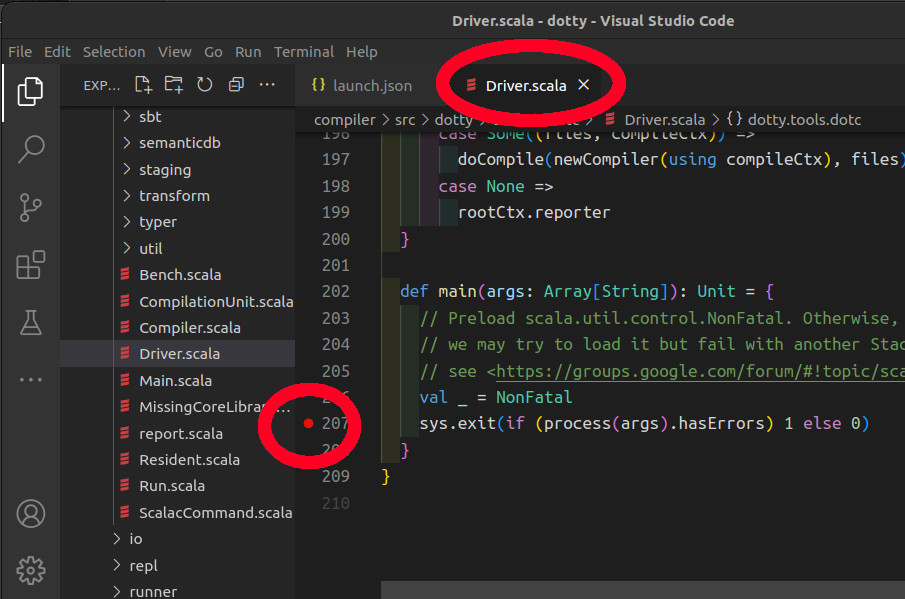
Starting the debugger
Before starting the debugger you need to put a breakpoint in the part of the code that you want to debug. If you don't know where to start, you can put a breakpoint in the main method of the dotty.tools.dotc.Driver trait.
Now to start the debugger, open the debug view, find the drop-down list of all the debug configurations and click on yours. The debugger should start and pause on your breakpoint.
Using the debugger
Navigating the call stack
When the debugger has paused, you can see the current call stack in the Debug and Run view. Each frame of the call stack contains different variables, whose values you can see in the Variables section of the Debug and Run view.
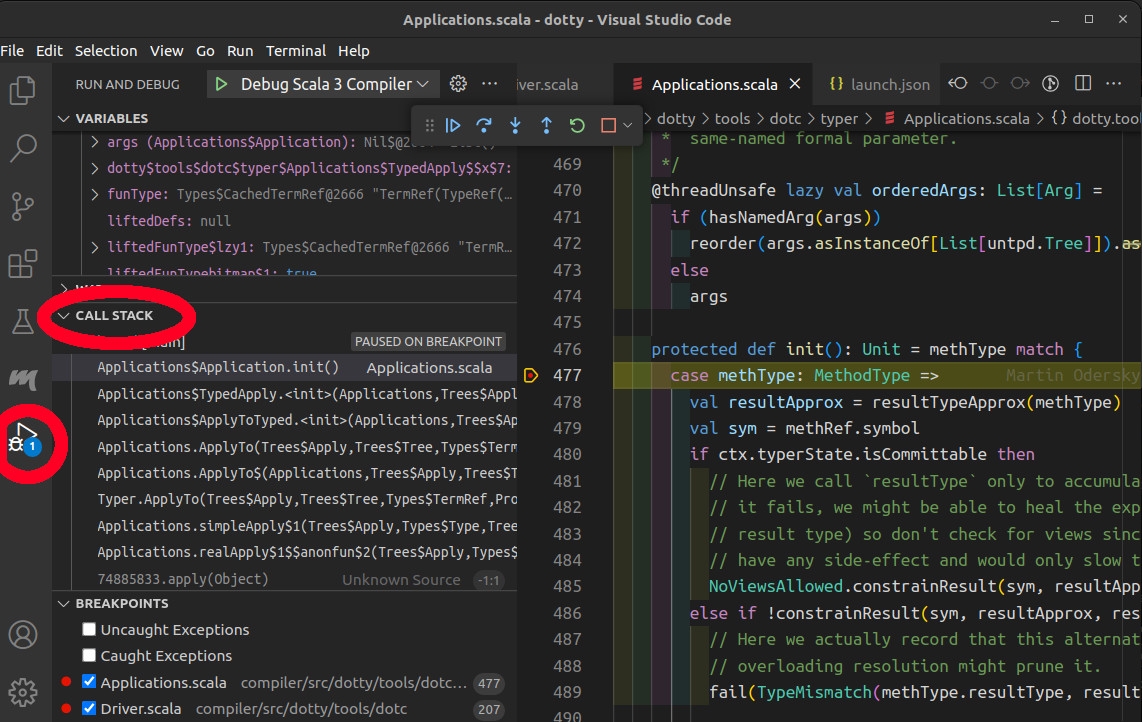
Analysing the call stack and the variables can help you understand the path taken by the compiler to reach that state.
The debugging steps
The debug toolbar contains the Continue / Pause, Step Over, Step Into, Step Out, Restart and Stop buttons.
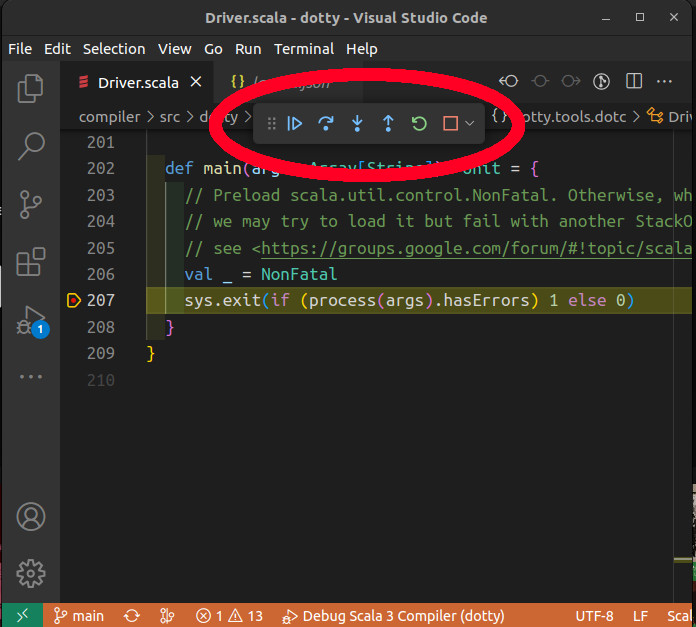
You can use the step buttons to execute the code step by step and get a precise understanding of the program.
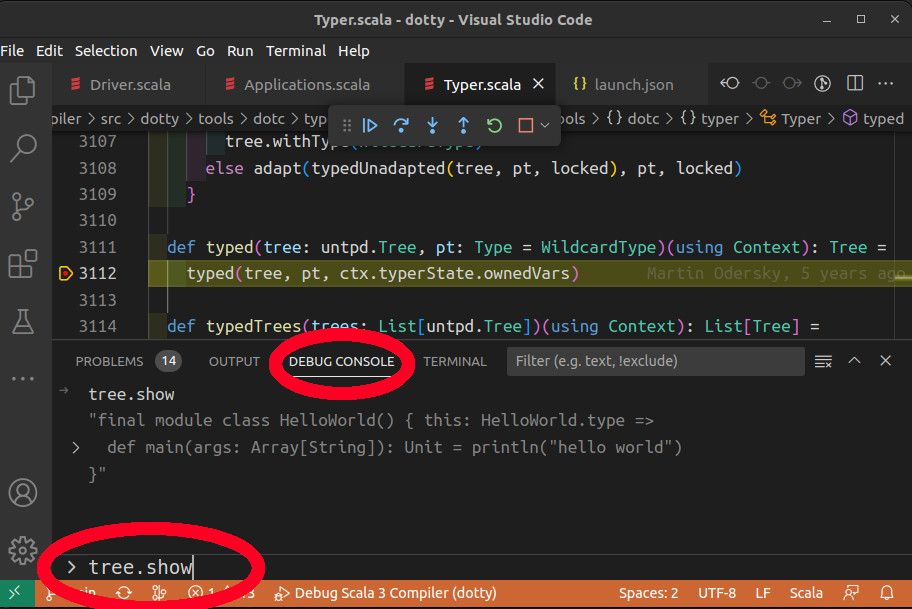
The debug console
When the debugger has paused, you can evaluate any Scala 3 expression in the debug console. This is useful to inspect some values or to execute some parts of the code.
For instance, you can evaluate tree.show to pretty-print a tree.
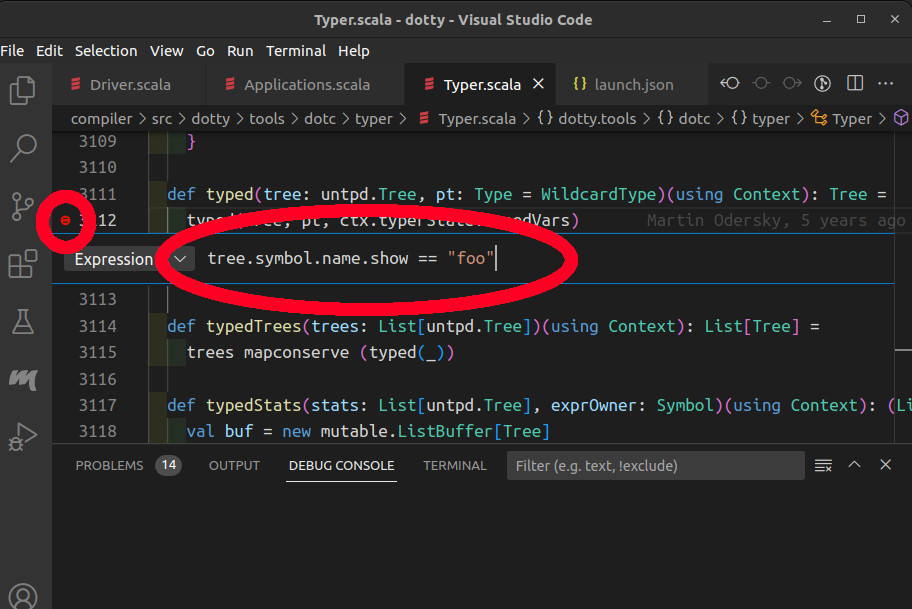
Conditional breakpoints
In a breakpoint you can define a condition, in the form of a Boolean expression written in Scala. The program will stop on the breakpoint as soon as the condition is met.
To add a condition, right-click on a breakpoint and pick Edit breakpoint....
For instance, if you know that a bug happens on typing a method foo, you can use the condition tree.symbol.name.show == "foo" in a breakpoint in the Typer.